Carbon Calculator Methodology
This carbon calculator illustrates the difference in financed carbon emissions of the selected EQ Investors portfolio(s) and a market equity index representing global companies (SPDR MSCI ACWI IMI UCITS ETF (exchange traded fund).
Financed emissions
We use reported and estimated carbon emissions equivalents data from Clarity AI per holding company. We only cover equity holdings for this carbon calculator to allow for full comparability and reweight to 100%.
To calculate the financed emissions, we adhere to the “Global GHG accounting & reporting standard for the finance industry by PCAF (Partnership for Carbon Accounting Financials). While PCAF mandates the inclusion of Scope 1 and 2 carbon data at this point, they encourage the inclusion of Scope 3 where possible (mandated by 2026). Please see below a brief explanation of these emissions scopes as defined by the Greenhouse Gas Protocol:
- Scope 1- covers direct emissions from owned or controlled sources. For example, the emissions from a companies’ power plant.
- Scope 2- covers indirect emissions from the generation of purchased electricity, steam, heating, and cooling. For example, the electricity purchased for company offices.
- Scope 3- covers all other indirect emissions that occur in a company’s value chain. For example, upstream emissions include the emissions associated with the purchase of raw materials to make products; downstream emissions include the emissions associated with the use of the products by customers.
- For most sectors, Scope 3 emissions present most emissions.
Financed emissions are calculated as follows:
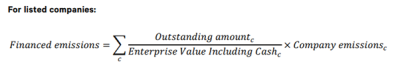
We then create a weighted average across the portfolio holdings and adjust for missing data by reweighting to 100%.
Equivalents
The equivalents are presented to illustrate the difference in financed emissions. The financed emissions by the selected EQ portfolio (s) are subtracted from the financed emissions associated with investing the same amount into a market equity index representing global companies (SPDR MSCI ACWI IMI UCITS ETF).
This difference is converted to equivalents of activities or products embodying different carbon emissions. These are listed below, with the source of the proxy.
| “Taking a car off the road” | Number of tCO2e emissions per average passenger vehicle per year | 4.6 | Source |
| “Power an average UK home” | Average annual tCO2e emissions per UK home per year (heating and electricity) | 4.05 | Source |
| “Flight from London to New York” | Average tCO2e emissions per passenger flight from LDN to NY, per passenger. The calculation assumes a 79.7% load factor with 346 seats on the B747-400 and 261 seats on the B767-300ER. | 0.59 | Source |
| “Eating one beef cheeseburger | Average tCO2e emissions associated with eating 1 beef cheeseburger | 0.004 | Source |
| “Driving from London to Glasgow by car” | Average tCO2e emissions associated with 1 petrol car journey from London to Glasgow | 0.09 | Source |
| “Boiling the kettle” | Average tCO2e emissions associated with boiling 1 kettle | 0.000007 | Source |
You can access the detailed methodology here.
