From time to time, markets go through periods of uncertainty. And while it’s natural to want to act when markets are down, it’s important to understand the possible impact of that reaction.
Market corrections are a normal part of the investment journey and can be triggered by several factors. Sometimes it’s an external crisis, like the coronavirus pandemic. Other times, a particular sector implodes and send ripples across the entire market.
Investor sentiment, economic indicators, global politics, and breaking news all play a role in determining whether and when a correction occurs…or doesn’t.
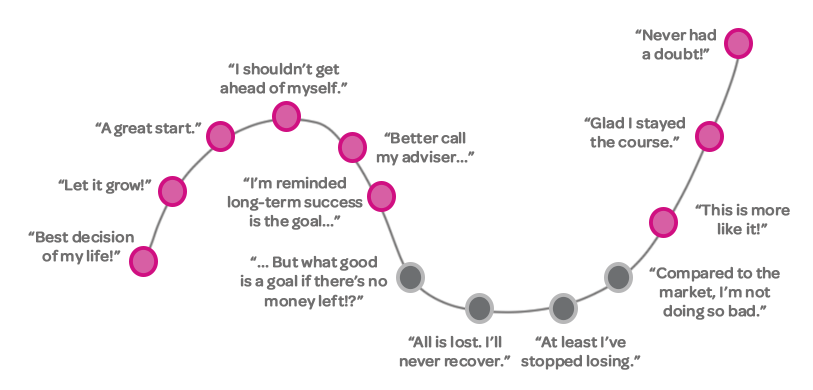
This chart is a simple way to look at how you might feel during a downturn. When markets start to recover, those who stayed invested tend to feel relieved, because they should be well-placed to benefit from the market recovery.

Trying to time the market
Staying invested for longer periods generally tends to offer a higher return potential. Historically, downturns in the market have been followed by an eventual upswing and being out of the market during those times can hurt long-term performance. The age-old adage applies here: ‘It’s all about time in the markets, not timing the markets.’
If you’re investing for the long-term, short-term fluctuations shouldn’t concern you much; in fact, it’s often a time where you should be adding more to your investments rather than taking them away.
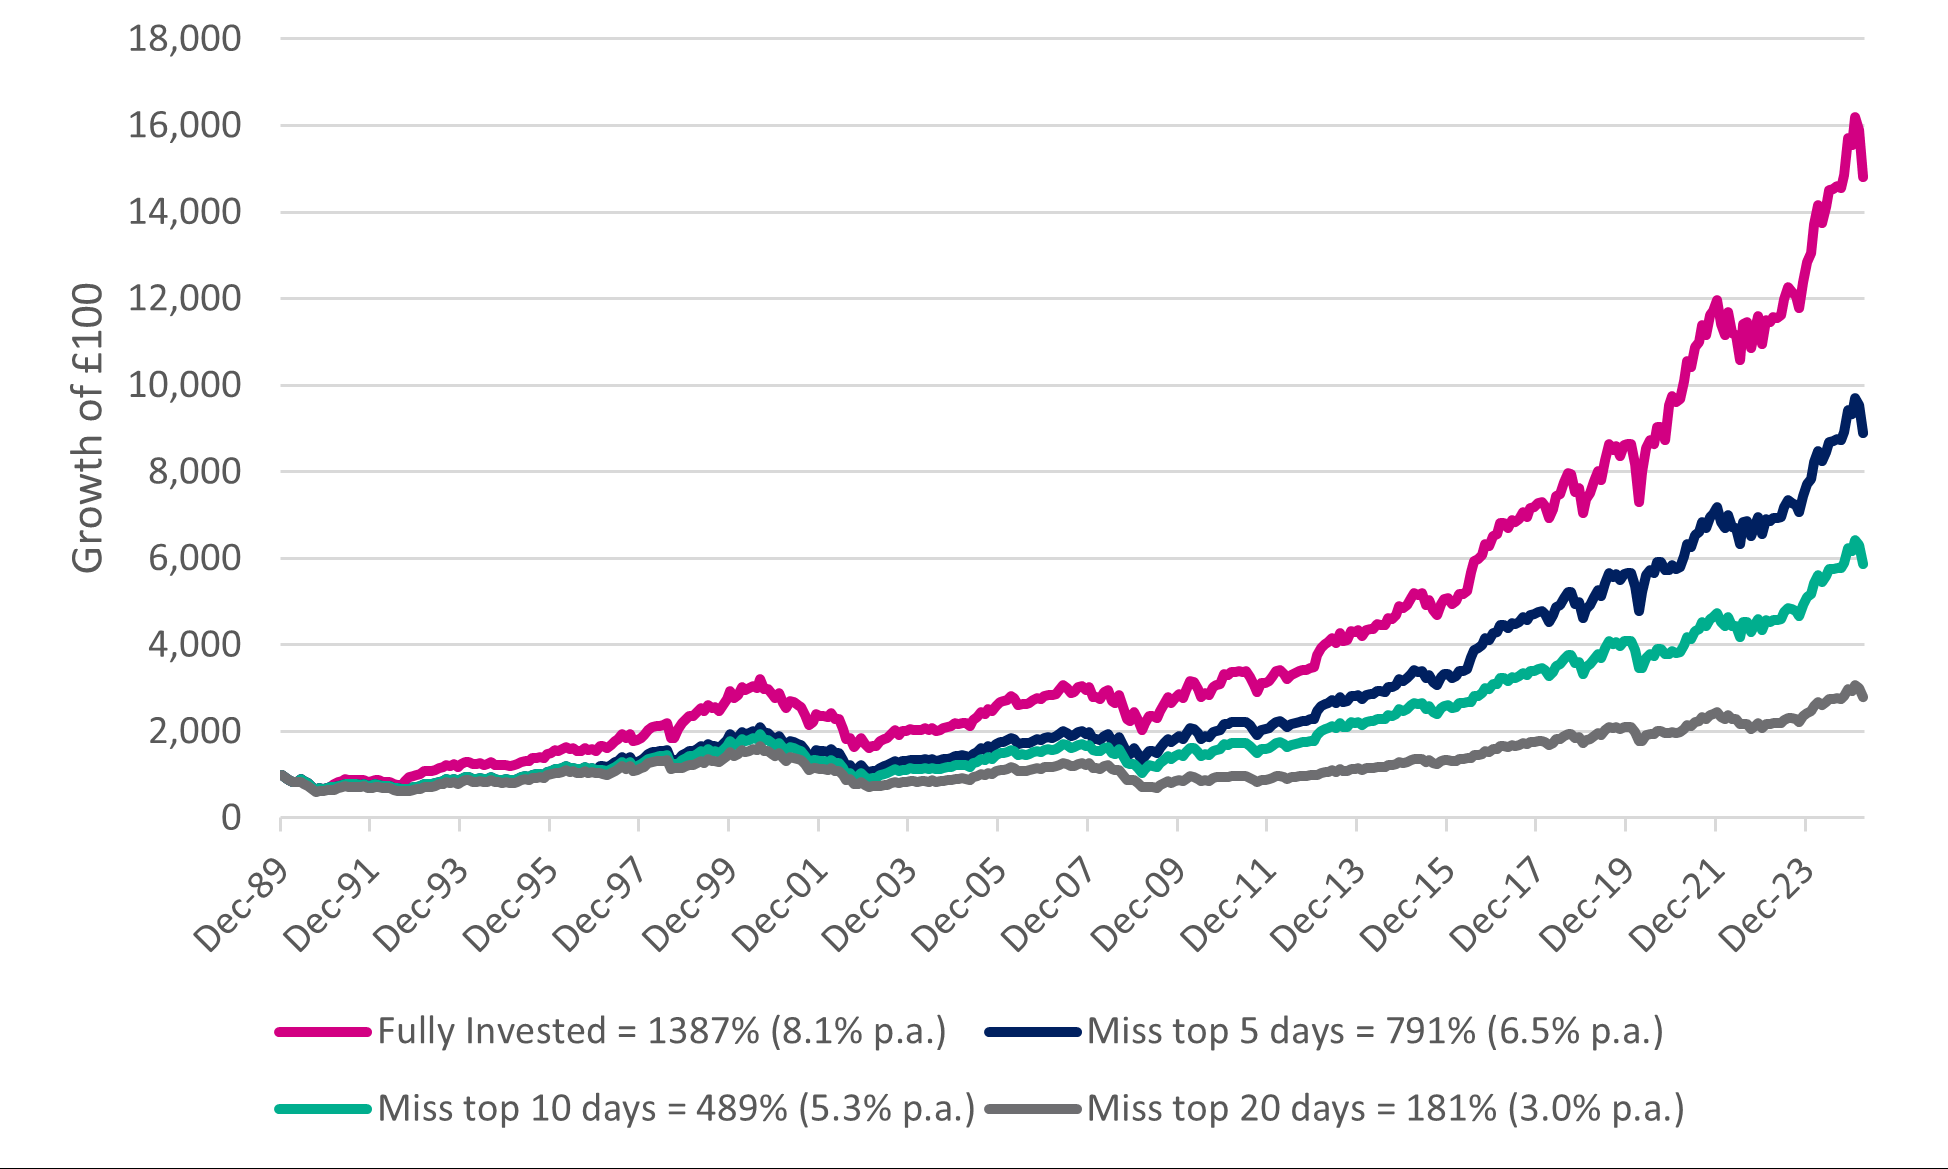
The chart below shows that missing even a few days of positive market activity can impact your portfolio. Over the last 30 years, your original £1,000 investment could have made a:
- 8.1% per year return if you stayed invested the whole time
- 6.5% per year return if you missed the 5 best days
- 5.3% per year return if you missed the 10 best days
- 3.0% per year return if you missed the 20 best days
Power of compounding since 1989

Source: EQ Investors
The 1.6% difference to annual returns between being invested the whole time and missing the five best days doesn’t seem much. But the compounding effect builds up over time.
Market fluctuations
Most of us only start to worry about the direction of markets when there has been a flow of bad news. In today’s 24/7 news cycle, dramatic headlines about market crashes and economic doom are commonplace. You might be considering switching to cash, with the idea of reinvesting in the future when feeling more positive about market prospects.
The problem with this type of reasoning is that it’s impossible to know when the market hits bottom. By the time you read about it in the news, prices will already have dropped and then you end up selling after already having lost considerable value. Or, on the recovery side, you buy in after the initial surge in value has passed and miss most of the upward momentum.
This behaviour has been measured in the USA for over 25 years in the Dalbar Quantitative Analysis of Investor Behavior (QAIB). The 2024 QAIB reaffirms past research finding that investors who remained patient and didn’t focus on short-term market gyrations were significantly more successful than those who let their emotions override a longer-term strategy to build wealth.
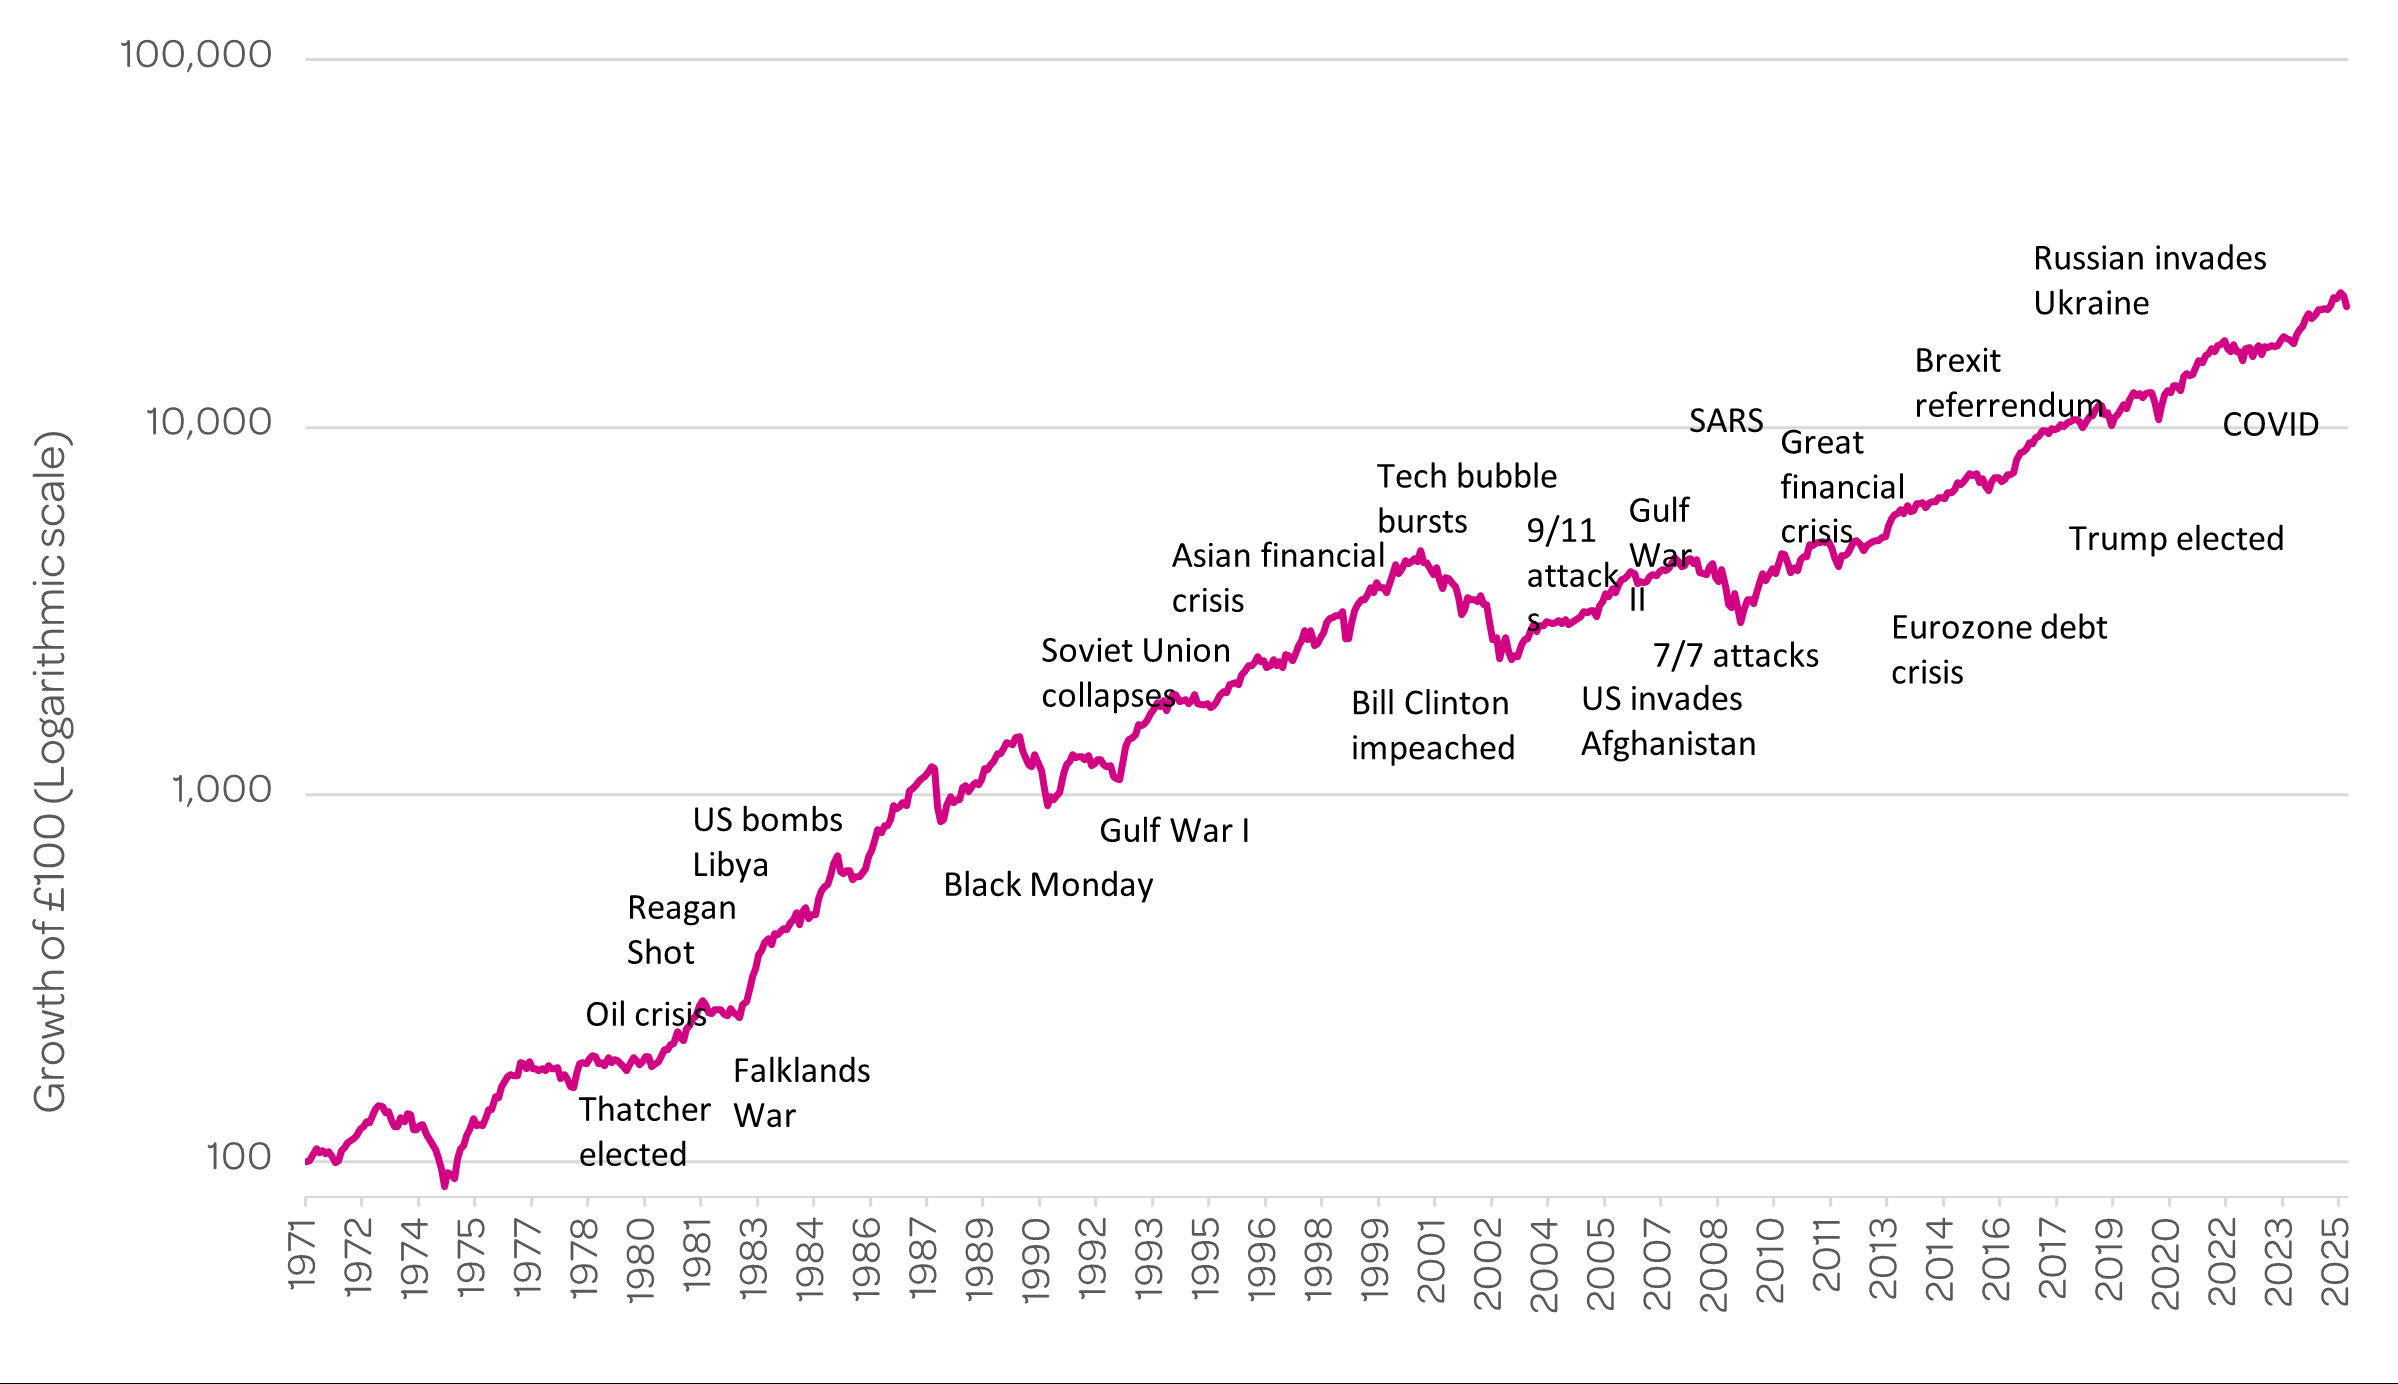
When looking at the big picture, every crisis in the graph below has been eclipsed by long-term growth. The irony is that historically many of the stock market’s best periods have tended to follow some of the worst days.
Events through time

Source: EQ Investors
An effective way to minimise panic selling is to take the focus off the present situation and think about where the market might be five years from now.
In the end, staying invested and contributing to a well-diversified portfolio is the best strategy regardless of market conditions.
What’s in store for the markets during the rest of 2025?
Uncertainty about the war in Eastern Europe, tariffs, recession fears and sticky inflation are all challenges that the market is grappling with. There could be continued volatility in the market in the immediate term as retaliatory tariffs are announced by non-US countries. But as negotiations proceed and as deals are struck, the potential for sharp rebounds in share prices is also high.
It appears the investment environment ahead is likely to be more politicised, protectionist and multi-polar than the last 20+ years. This adjustment won’t happen overnight but it creates a new set of investment opportunities for long-term investors.
Keeping you focused on the long term
What’s important though is that you focus on your long-term goals and remember that time, not market timing, is on your side.
This is where your financial planner can be of benefit – to help you remain focused on your goals and understand the reasons for remaining invested.
This is where your EQ financial planner can be of benefit – to help you remain focused on your goals and understand the reasons for remaining invested. They can give you confidence in your well thought-out plan that effectively accounts for market uncertainty.
On a final note, ask yourself whether there have been any significant changes to your personal circumstances, financial objectives, and risk profile to warrant a review of your current investment plan.
To discuss your situation, why not get in touch for a free consultation with one of our financial experts today.
Please remember, this content is provided for information purposes only. Investment involves risk. Past performance is not a guarantee or indication of future results. Investment return and the principal value of an investment may go up or down and may result in the loss of the amount originally invested. All investors should seek professional advice prior to any investment decision, to determine the risks associated with the investment and its suitability.